Columbus State University Campus Plan Update 2016
Strategies:
Institutional Mission and Student Body Profile
Columbus State University is a four-year public institution that offers more than 100 programs at the certificate, associate, bachelor’s, master’s, specialist, and doctoral levels. Many degrees are conferred in professional areas of pursuit at both undergraduate and graduate levels in response to student demand and service area needs.
Institutional Mission
The mission of Columbus State University is:
We empower people to contribute to the advancement of our local and global communities through an emphasis on excellence in teaching and research, life-long learning, cultural enrichment, public-private partnerships, and service to others.
The institutional focus on excellence in teaching and research as well as the emphasis on life-long learning, cultural enrichment, public-private partnerships and service to others influences the key priorities of the college completion work undertaken by Columbus State University. Because effective teaching is a central component of student success, the CSU Faculty Center for the Enhancement of Teaching and Learning supports faculty members as they investigate and implement new pedagogical strategies that support millennial learners. The University financially supports student research and creative inquiry projects facilitated by faculty mentors. CSU has a strong commitment to service and has provided significant leadership in meeting the needs of the community, the region, and the state through endeavors such as the Early College initiative, service to military-affiliated students, and the development of high-quality online programs that allow students to decrease time to completion and increase the timely accomplishment of their educational goals regardless of their geographic location.
Student Body Profile
In Fall 2015, CSU enrolled 8,440 students, including an undergraduate student population of 6,937. Enrollment increased by three percent over Fall 2014. The institution’s population is comprised of 65% full-time students. CSU also follows national trends with the female population representing 60% of the student body. The student population is 53% white, 36% black, 2% Asian, 5% Hispanic, and 4% other (American Indian or Alaskan Native, international, two or more races, or unknown). Since Fall 2010, the number of transfer students has risen by 15.7%. In Fall 2015, the institution increased the number of new transfer students by 11 (1.6%) from the previous year. Of the new transfer students in Fall 2015, 60 (9%) transferred from Columbus Technical College, with whom the university has a robust articulation agreement. Of the total undergraduate student population, 2,059 (30%) of these students were first generation college students.
Columbus State University utilizes moderately selective admissions standards and processes for most applicants (high school grade point average of 2.5 and SAT minimum scores of 440 Critical Reading and 410 Math or ACT English 17/Math 17). Modified standards are utilized for applicants within the local service area in accordance with the University System of Georgia-mandated local access mission (high school grade point average of 2.0 and SAT minimum scores of 330 Critical Reading and 310 Math or ACT English 12/Math 14).
The University System of Georgia (USG) designates CSU as one of the three “access” institutions within the state because no state colleges in the USG are located within the geographic service area. The service area of Columbus State University is defined in terms of the following Georgia counties: Chattahoochee, Harris, Marion, Meriwether, Muscogee, Stewart, Talbot, Taylor, and Troup. In Fall 2015, 42.9% of the new student population was drawn from these counties.
The University takes pride in its role as an access institution, but this role also presents challenges in student recruitment and retention. As noted in Tables 1.1 and 1.2 below, first-time, full-time students admitted with learning support status through the institution’s access mission were retained and graduated at much lower rates than students admitted with regular admission status. These tables display FT/FT because total retention or graduation rates would include transfer students.
Table 1.1: CSU Retention Rate Trends for First-Time, Full-Time Freshmen: 2008-2009 through 2014-2015
|
2008-2009 |
2009-2010 |
2010-2011 |
2011-2012 |
2012-2013 |
2013-2014 |
2014-2015 |
|
|
Non-Learning Support |
67.9% |
72.1% |
70.4% |
67.7% |
67.7% |
72.8% |
72.1% |
|
Learning Support |
46.3% |
54.7% |
59.5% |
49.6% |
51.9% |
47.7% |
64.3% |
|
Total |
63.3% |
68.1% |
68.2% |
65.6% |
66.2% |
70.1% |
71.2% |
Table 1.2: CSU Bachelor’s Degree Six-Year Graduation Rate Trends for First-Time, Full-Time Freshmen: 2003-2009 through 2009-2015
|
2003-2009 |
2004-2010 |
2005-2011 |
2006-2012 |
2007-2013 |
2008-2014 |
2009-2015 |
|
|
Non-Learning Support |
319 |
288 |
312 |
335 |
274 |
331 |
345 |
|
36.0% |
34.9% |
34.2% |
39.5% |
35.2% |
37.7% |
36.5% |
|
|
Learning Support |
24 |
30 |
15 |
26 |
26 |
28 |
26 |
|
14.6% |
19.0% |
9.0% |
11.4% |
12.7% |
12.0% |
9.3% |
|
|
Total |
343 |
318 |
327 |
361 |
300 |
359 |
371 |
|
32.6% |
32.3% |
30.3% |
33.6% |
30.5% |
32.3% |
30.3% |
Columbus State University continues to address the goals and objectives identified in the CSU Complete College Georgia plan. We look forward to continuing this work as we believe that it will positively impact the lives of our students.
Institutional Completion Goals, High-Impact Strategies and Activities
Goal 1.2 Increase degree completion in STEM fields.
CSU has been and will continue to be successful in attracting students to and graduating students from our STEM programs. In 2015-2016, we focused our efforts on recruitment and retention.
Meeting this goal would make Columbus State a contender in the competition for math, science, computer science and engineering students. CSU is striving to become a “First Choice” institution for STEM study.
|
Strategy 1.2 Increase degree completion in STEM fields. |
||||||||||||||||
|
Goal |
Increase the number of students graduating with degrees in the STEM fields. |
|||||||||||||||
|
High-Impact Strategy |
Focus on recruitment and retention. |
|||||||||||||||
|
Demonstration of Impact |
Targets the kinds of students we want to recruit and retain. Currently, STEM majors constitute 18% of the student body. |
|||||||||||||||
|
Principle Points of Contact |
Dr. Kim Shaw, UTeach Project Co-Director Dr. Deborah Gober, UTeach Project Co-Director Dr. Tim Howard, Associate Dean of the College of Letters and Sciences Dr. Eliot Rendleman, Director of Academic Center for Tutoring (ACT) |
|||||||||||||||
|
Summary of the Activities |
Recruitment Participated in the Robert Noyce Teacher Scholarship Program. In the past, we have offered these scholarships to CSU juniors and seniors but have attempted to attract more transfer students into the UTeach Program. In 2015-2016, nine students were awarded Robert Noyce Teacher Scholarships, five of whom transferred in with 60 or more semester hours of credit. So far, we have offered seven scholarships for 2016-2017, including two students who transferred in 60+ hours, but we project that we will have nearly 10-15 total award recipients by spring semester. In 2015, CSU was one of three schools in the state to offer Woodrow Wilson Teaching Fellowships. CSU had 1/3 of the fellows (12/36); all twelve of them are now teaching in Georgia. In Fall 2016, CSU is one of five schools in the state to offer this Fellowship. It has twelve new students in the program, with eight of the twelve from outside of Georgia. Graduates from the Woodrow Wilson MAT commit to teaching in high schools in Georgia for three years after they finish the program. Projected FOCUS replication via the first two courses in the UTeach Columbus program.
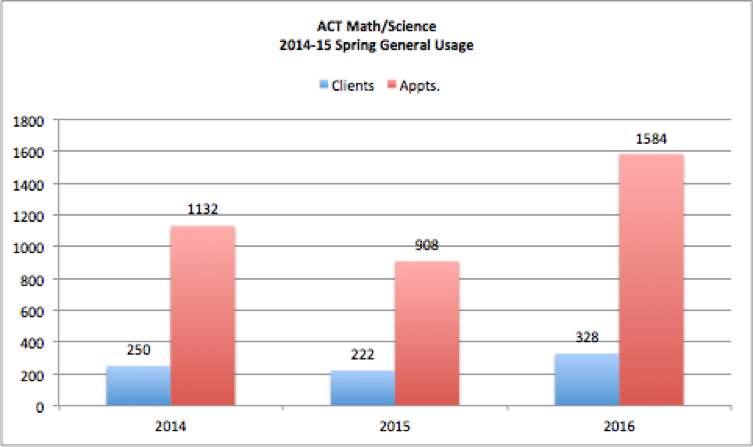
Retention Provided tutoring to students in gateway STEM courses. In FY16, 328 students logged 1584 visits to seek tutoring in gateway courses (4.82 visits per student). Just to emphasize – this does not capture all of the tutoring that was conducted. It omits tutoring for Learning Support courses, some upper division STEM courses, math/science courses for Early Childhood Education majors, and non-STEM courses such as BUSA 3115 (Quantitative Analysis for Business Decisions I) and others.
Trained and provided Peer Instruction Leaders for targeted STEM introductory level courses. Provided peer leader support program for CHEM 1211 (Fall 2015) and CHEM 1212, MATH 1111, and MATH 1113 (Spring 2016). In Fall 2015, the Peer Leader Program had 100 clients with 583 appointments. In Spring 2016, the program had 170 clients with 805 appointments. In half the cases, students attending the ACT had higher GPAs than those students not attending the ACT.
|
|||||||||||||||
|
Baseline Status |
FY10: 86 students completing bachelor’s degrees in STEM fields |
|||||||||||||||
|
Interim Measures of Progress |
Number of students currently enrolled in STEM programs.
Number of currently enrolled students making satisfactory academic progress (Overall GPA of 2.0 or higher).
|
|||||||||||||||
|
Measures of Success |
Increase of 3% per year of students completing bachelor’s degrees in STEM fields (mathematics, environmental science, chemistry, biology, computer science, geology, secondary science, or mathematics education). We attribute these increases to tutoring in Gateway STEM courses and peer instruction. Target of 150 students by FY20.
|
|||||||||||||||
|
Lessons Learned |
We have made great strides in keeping STEM students by emphasizing tutoring and peer instructional leaders. Retaining them has resulted in an increase in number of graduates of 3+% per year (since FY10). |
|||||||||||||||
Goal 2.1 Change institutional culture to emphasize taking full-time course loads (15 or more credits per semester) to earn degrees “on time.”
In 2013, a review of institutional data indicated that many students were not enrolled in a minimum of 15 credit hours each term. In Fall 2013, 3,680 undergraduate students were taking less than 15 credit hours per term. This group had an average overall GPA of 2.81. During the same term, 1,015 were enrolled in 15 or more credit hours. The average overall GPA of that group was 3.12. A campus-wide initiative was implemented in Summer 2014 to provide new students beginning in Fall 2014 with 15-hour schedules for their first term of study. These schedules were developed in advance by academic advisors with input from the students.
Since Fall 2014, we have provided information on the 15-to-Finish campaign to incoming students through our orientation presentations and to faculty staff advisors through our advising training sessions throughout fall and spring semesters.
|
Strategy 2.1 Change institutional culture to emphasize taking full-time course loads (15 or more credits per semester) to earn degrees “on time.” |
|
|
Goal |
Increase the number of students enrolled in 15 or more credits per semester. |
|
High-Impact Strategies |
|
|
Demonstration of Impact |
These high-impact strategies are designed to motivate students enroll full time rather than part time. |
|
Principle Points of Contact |
Dr. Tina Butcher, Interim Provost Dr. Melody Shumaker, Coordinator of Learning Support and of First-Year Experience Dr. Barbara Hunt, Project Manager, CSU’s CCG Initiative |
|
Summary of the Activities |
Worked on redesigning first-year experience—currently a bottleneck with freshmen learning communities. A First-Year Experience Committee met multiple times during the year to discuss everything related to first-year experience. The committee decided to continue both the freshmen learning communities and the “common read.” The freshmen learning communities are now better balanced and reflect a better distribution of college participation in course offerings. Improved scheduling of courses—number of sections, number and types of Freshman Learning Communities, distribution/balance of core courses needed—to improve student access to needed classes and to allow students to follow the program maps published in the catalogs. Using the program maps developed in 2015-2016, the Provost’s Office created a tentative “course demand” schedule indicating the number of seats needed in certain core courses, both in core areas with multiple course offerings and in core areas with courses specified by the USG. This “course demand” schedule will be better defined in the coming years. Continued using preference survey. The University is pro-actively sending preferences surveys to new students ahead of orientation and creating schedules prior to them attending orientation. This ensures students are taking 15 credit hours, courses related to their major, and a balanced schedule that fosters success.
|
|
Baseline Status |
In Fall 2013, 1,951 students (27.8%) were enrolled in 15 hours or more. |
|
Interim Measures of Progress |
Increased number of students enrolled in 15 hours or more. |
|
Measures of Success |
Increased number of students enrolled in 15 hours or more—increase of 4.4% from Fall 2013 to Fall 2016.
See Appendix I for cohort progression of earned credits. |
|
Lessons Learned |
Creating a precise “course demand” schedule is extremely difficult but necessary if we are going to offer the right number and kinds of courses students need to progress. |
Goal 4.2 Use predictive analytics (EAB, D2L, or Ellucian) to help identify students who are off-track and help students understand their likelihood of success in particular programs.
In an effort to boost RPG, in 2014 CSU developed an advising information system that included an early alert system and academic analytic functionality. After viewing demos of similar software and consulting with our Information Technology department, CSU decided to build its own Student Advising Portal (SAP) to meet its specific needs. The system complemented DegreeWorks and included student information such as demographic data, contact information, academic history, standardized test scores, and academic analytics that assisted students in choosing appropriate majors. The Academic Center for Excellence (ACE) spent the three semesters (fall ’15, spring ’16 and summer ’16) loading data and customizing the software for advisors’ and students’ specific needs.
The creation of SAP resulted in targeted, timely interventions for underclassmen, allowing advisors to create action plans and/or refer students to appropriate resources on a daily basis. During the past academic year, ACE continued using the home-grown portal to identify at-risk students and provide timely interventions.
However, during fall 2015, the decision was made to move from the home-grown SAP in order to partner with Education Advisory Board’s (EAB) Student Success Collaborative (SSC) technology. EAB is going into production in Fall 2106. The decision to move away from the home-grown system in lieu of EAB was due to limited internal resources, needed on other projects; therefore, we lacked the resources to create and implement phases II and III of the project. Institutional leadership felt that a third party vendor was a better long-term return on investment.
|
Strategy 4.2 Use predictive analytics (EAB, D2L, or Ellucian) to help identify students who are off-track and help students understand their likelihood of success in particular programs. |
|||||||||||||||||||||||||||||
|
Goals |
|
||||||||||||||||||||||||||||
|
High-Impact Strategies |
|
||||||||||||||||||||||||||||
|
Demonstration of Impact |
Identify and aid at-risk students; train faculty in use of Brightspace |
||||||||||||||||||||||||||||
|
Principle Points of Contact |
Ms. Lisa Shaw, Director, Academic Center for Excellence (ACE) Mr. Dustin Worsley, Assistant Director, ACE Mr. Sri Sitharaman, Director, Institutional Research and Effectiveness Ms. Amy Thornton, Director, Center of Online Learning (COOL) |
||||||||||||||||||||||||||||
|
Summary of the Activities |
ACE met with at-risk students identified through its Early Alert System (EAS) and referred identified students to appropriate and effective campus resources, such as Tutorial Services, Counseling, Office of Disability Services, and the Center for Career Development. Every day, ACE advisers check their list of students with new alerts in the portal. Within 24 hours they contact the student (via email, phone, etc., depending on the student’s preference). The adviser then refers the student to an appropriate resource or creates an action plan to monitor the student and hold them accountable. The adviser then logs all activity in the notes section of the portal. ACE educated faculty to use the Early Alert System (EAS). EAS is designed to assist undergraduate students who demonstrate difficulty in their classes by making them aware of support services available and by encouraging them to use these resources to promote academic success and student retention. We are shifting our workflow to EAB to include Early Alert. ACE emailed faculty the link to the online Early Alert System referral form (https://ace.columbusstate.edu/early_alert.php). Faculty members completed the referral at a secured site and students were contacted by the Academic Center for Excellence. COOL continued offering workshops for faculty to learn how to use D2L Brightspace to report in-progress grades and to understand why such communication is important |
||||||||||||||||||||||||||||
|
Baseline Status |
Baseline for EAS was 48 for 2013-2014.
|
||||||||||||||||||||||||||||
|
Interim Measures of Progress |
Increase faculty referral rate of EAS. Increase number of faculty using D2L Brightspace as their grade book through training and consultations. Center of Online Learning (COOL) collected data based on number of consultations and number who attend training, but not a headcount of individual faculty who use the services. Below are the numbers provided by the Center of Online Learning (COOL) for June 1, 2015 - May 31, 2016:
|
||||||||||||||||||||||||||||
|
Measures of Success |
Success is measured by EAS referral rates, percentage of credits successfully completed, retention rate, and graduation rate. EAS referral rates.
Percentage of credits successfully completed (A, B, C, P, S) versus attempted (A, B, C, D, F, U, W, WF) each fall semester for the past 5 years. For freshmen, the percentage of earned to enrolled credits were:
Retention rate:
Overall Retention increase from FY15 to FY 16 was 1.0%
Overall Retention increase from FY15 to FY16 was 2.1% In 2013, we established our retention rate goal as 75% by 2020.
Our 2020 goal is 36%. We are currently at 30.3% for FT/FT freshmen. |
||||||||||||||||||||||||||||
|
Lessons Learned |
|
||||||||||||||||||||||||||||
Goal 7.2 Combine remediation in English and reading.
In accordance with recommendations made by the USG Committee on Transforming Remediation, in 2015 CSU revamped the remediation model for students requiring support in English and reading. Beginning Fall 2015, there were only two areas of remediation: English and math. Reading remediation as a separate course no longer existed.
Entering freshmen who scored significantly below the institution’s admission requirements in English and reading were placed in an Integrated Reading and Writing (IRW) course, ENGL 0989, Foundations for English Composition. Following the successful completion of this course, students then enrolled in ENGL 1101 with a co-requisite, one-credit remedial course ENGL 0999 Support for English Composition. The goal for combining English and reading remediation was for students with significant reading and writing remedial needs to complete the gateway English composition course within two semesters, or one academic year.
Students who required only writing remediation, or whose placement scores were not significantly below admissions requirements, were placed in the gateway course, ENGL 1101, with the co-requisite ENGL 0999. The goal for these students was successful completion of the gateway course in one semester by providing the additional support of ENGL 0999.
Creating these two new courses (ENGL 0989 and ENGL 0999) required having numerous committee meetings, offering training sessions (for advisors, enrollment services staff, and instructors), and working with UITS. Below we chart the success of this endeavor, begun in Fall 2015, because we now have some data to report.
|
Strategy 7.2. Combine remediation in English and reading. |
|
|
Goal |
Reduce time for completion of gateway courses. |
|
High-impact strategies |
|
|
Summary of the Activities |
|
|
Baseline Status |
Metric 7.2: Number of students receiving co-requisite remediation in Fall 2015 in English (or combined English/reading): 29 |
|
Interim Measures of Progress |
Completed progression of activities on schedule and placed students in appropriate courses. |
|
Measures of Success |
We can validate the following goals: →60% of students assigned to ENGL 1101/0999 will exit LS and pass ENGL 1101 on the first attempt. □ % of students assigned to ENGL 1101/0999 who passed ENGL 1101 on first attempt— Spring 2016: 75% (18/24) →60% of students assigned to the IRW foundations course (ENGL 0098) will successfully complete ENGL 1101 within one year of enrollment. □ % of students assigned to ENGL 0989 who successfully completed ENGL 1101 within 1 year (F 2015 only since Spring 2016 information not yet available): 61.5% (16/26) |
|
Lessons Learned |
Teachers of the IRW Foundations course and of the co-requisite ENGL 1101/0999 courses are English teachers trained to teach writing; they needed to be cross-trained to teach reading as well, quite a different discipline from that of their primary SACS qualifications. |
With this goal, we have increased completion rates for our students needing English and/or reading remediation by removing obstacles to entering college credit courses, while providing appropriate support for those who need remedial help.
Goal 8.1: Expand completely online opportunities.
|
Strategy 8.1: Expand completely online opportunities. |
|
|
Goal |
Restructure online support services to enhance educational excellence and student success. |
|
High-Impact Strategy |
Improve online opportunities and experiences at CSU. |
|
Demonstration of Impact |
Access to administrative functions is an obstacle to completion. The lack of online forms and processes affects many students, especially those who are enrolled in completely online programs. CSU has 1,545 fully online students (18%); 3,292 students are taking some online courses (39%). |
|
Principle Points of Contact |
Dr. Barbara Hunt, Project Director, CSU’s CCG Initiative Dr. Ellen Roberts, Associate Provost for Online Education Dr. John McElveen, Associate Vice President for Enrollment Management |
|
Summary of the Activities |
Put these forms online (2015-2016) for ease of use by all students:
The Change of Major workflow automation is live, as of 8/15/16. The DegreeWorks Adjustment form and the Exception Petition form as available as online forms, but not yet as workflow automations. Identified, reviewed, edited (as necessary) and then prioritized all existing academic administrative forms in 2015-2016 to ensure ease of access by all students. A number of priority enhancements have been identified and are in process of being developed:
Identified and inventoried which student services are not online but should be. Then prioritized and prepared a project plan for ensuring online students have equal access.
|
|
Baseline Status |
0 forms online |
|
Interim Measures of Progress |
Progress in creating three specified online forms. |
|
Measures of Success |
Completion of three specified online forms. One automated form completed; the others are online, but not yet automated. By completing these forms, we gain efficiency. For example, using paper, it would take two weeks for students to fully implement a change of major. Online forms enable this to happen in one to three days. |
|
Lessons Learned |
Putting all forms and processes online is a time-consuming process, but a necessary one for the benefit of our online students and programs; allowing student access and helping faculty with technology are vital for the improvement of the online experience. |
Observations
Successful Strategies from last year:
Increasing STEM recruitment and retention by using a multipronged approach. We saw an increase in the retention of students due to our emphasis on tutoring and peer instructional leaders and an increase in productive grades, as well as a 3.25% increase in the number of graduates. We also improved future recruitment opportunities through our STEM Honors Camp, Robert Noyce Teacher Scholarship Program, and Woodrow Wilson Teaching Fellowships.
Targeting institution culture to increase number of students enrolled in 15 or more hours. Success here is due to preregistering students and showing the 15-to-Finish video to students and families at orientation. There was an increase of 4.4% since Fall 2013 in the number of students enrolled in 15 or more hours. We also focused efforts to offer the numbers and kinds of core classes needed as well as rewarded juniors and seniors with extra special attention (such as increased number of internships and workshops on soft-skills development).
Transforming the catalog to include program maps for all undergraduate degrees. We are confident that these maps will positively impact RPG in the future and contribute greatly to the culture of “15-to-finish.” The 2016-2017 catalog represents the third year these maps are included. In addition, five interest-area metamajor maps were developed for entering freshmen who are having difficulty deciding on a major.
Using various methods to keep students on track and identify students at risk. These methods range from training faculty in use of Brightspace, reminding faculty to use the Early Alert System, and using intentional and proactive advising to refer students to appropriate and effective campus resources.
Improving efforts at providing better targeted tutoring and peer instructional support for all students, but especially for STEM students, thereby providing students with the skills they need to pass the collegiate course in which they are enrolled. Data indicates that about 50% of the time, students attending the ACT have higher GPAs than those who do not.
Working tirelessly across constituent groups to automate what were previously paper-based forms and processes so that obstacles to efficiency are removed. Students who are 100% online are still at a disadvantage but we are working to level the playing field. We have automated one form, put all paper-forms on line for easy of submission, and have identified goals for next year.
Continuing to use the Discussion Board requesting suggestions for improving RPG at CSU. We derived the specifics for our 2015-2016 goals by creating an interactive website (http://aa.columbusstate.edu/completecollege/ ) where 50+ stakeholders (faculty, students, staff, alumni, retired faculty and staff) offered suggestions for ways to improve RPG at Columbus State. CSU’s CCG Council then met to determine which ideas seemed the most feasible and the most likely to positively impact RPG. The Council continued this approach in FY 2016, deciding to continue the same goals as last year.
Least Effective Strategies from last year:
All strategies tried seem to be effective but a couple of times we dropped the ball and did not do what we said we would do. Lesson learned: Sometimes we dream bigger than what we can realistically accomplish due to financial or labor restraints.